
Experimental research · Case study
Following the fire.
Mapping the evidence.
An office-and-living-space experiment: from the first flame to a complete map of calcination depth.
Room & fire scenario
An everyday setting.
A defined experiment.
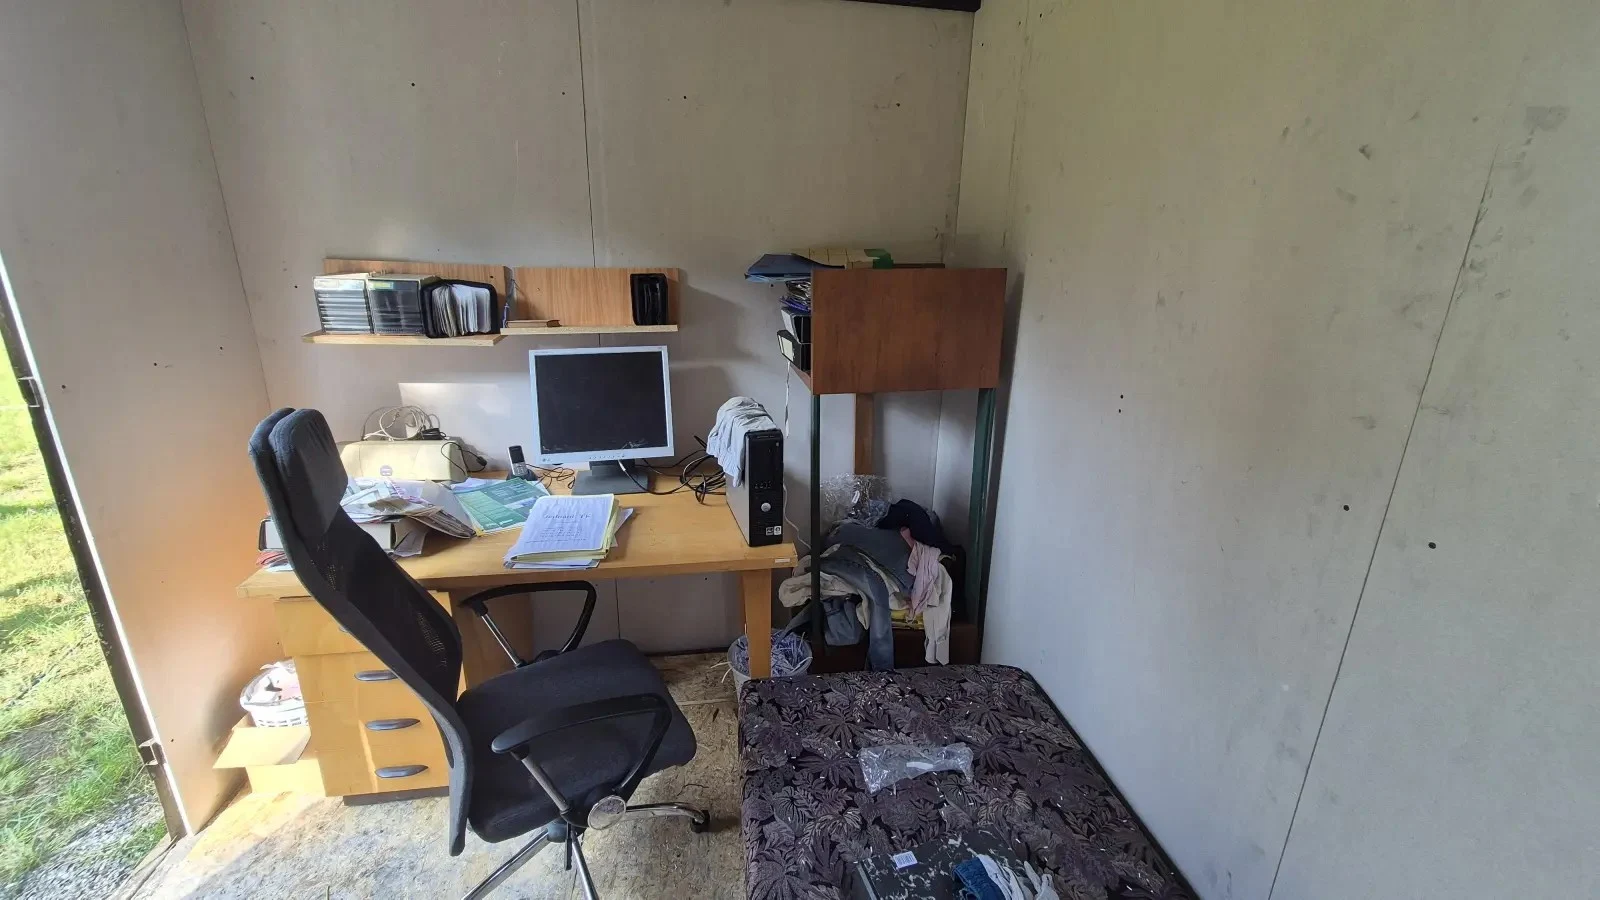
The experimental fire compartment was furnished as an office, with a computer, a printer, open file storage and other typical office equipment. A bed was included to represent a combined working and living space.
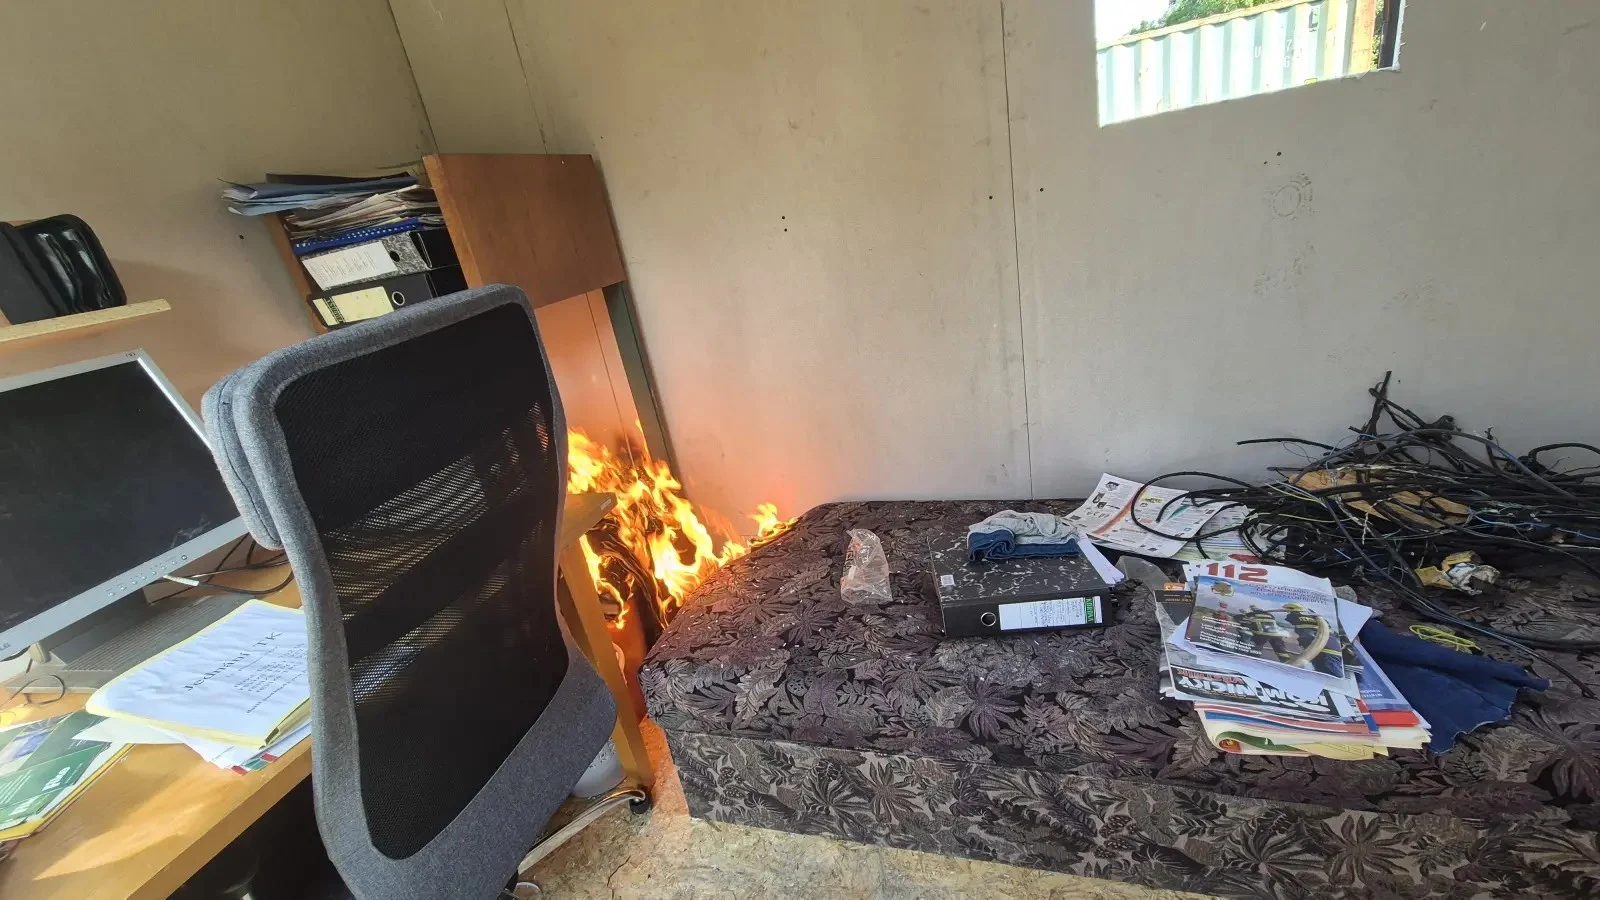
The scenario placed ignition between the bed and the storage unit. It represented a fault in an extension cable connected to a socket behind the bed. The cable ran behind the storage furniture; in the scenario, pinching damaged the cable, causing a short circuit and ignition of nearby material.
Fire development
The fire developed for approximately 11 minutes before flashover. It was then extinguished using one C-type attack hoseline.
Post-fire inspection
Reading the room.
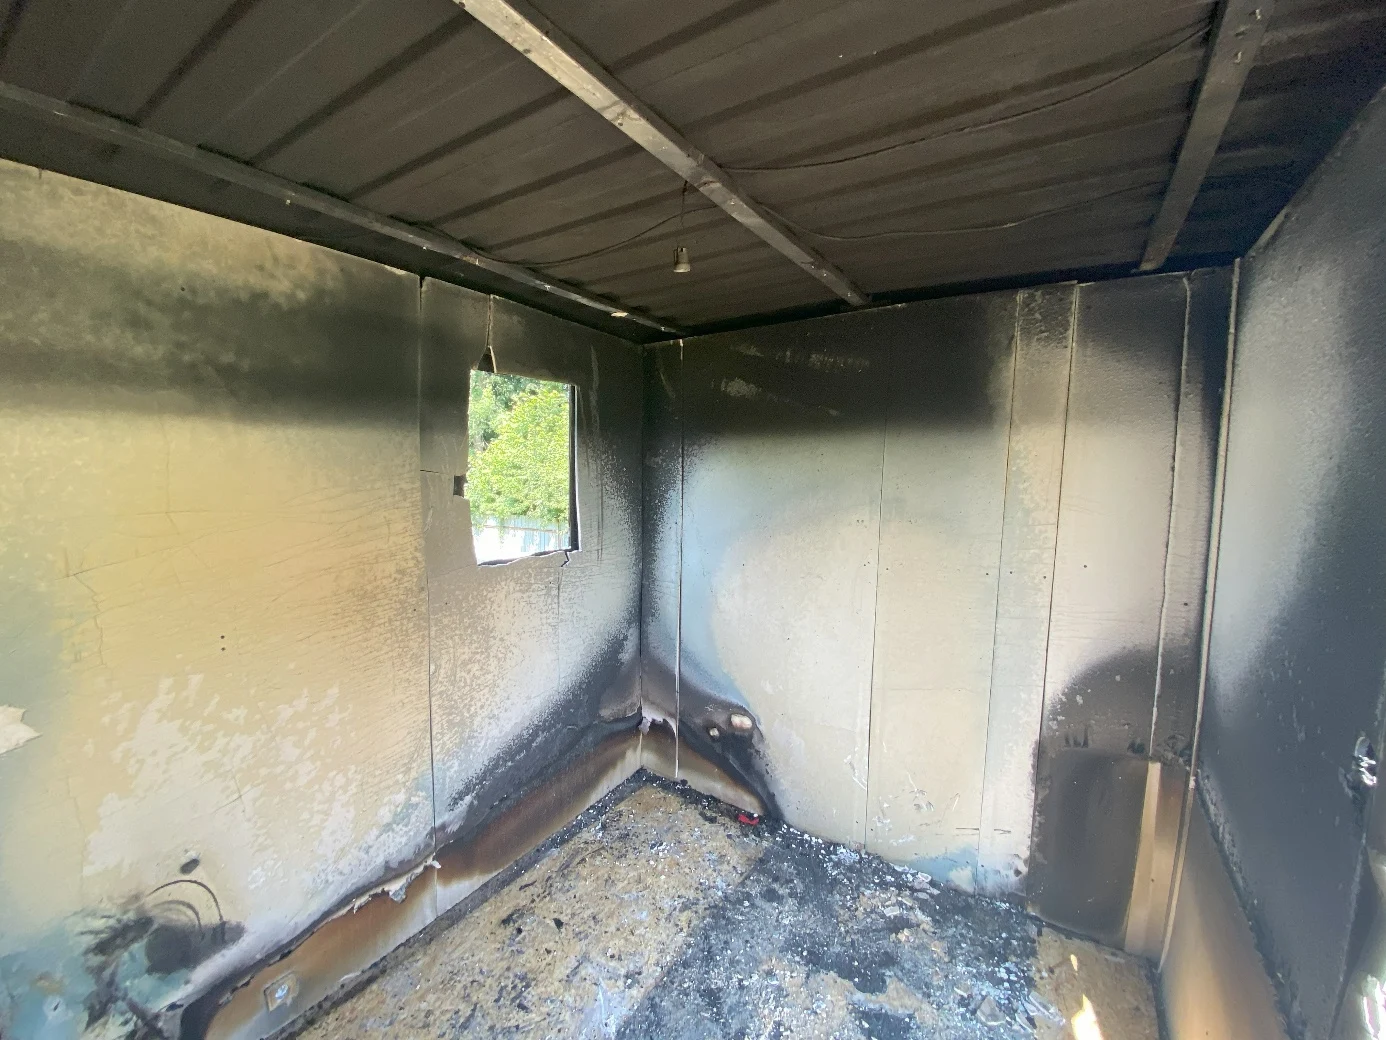
The inspection placed the area of origin between the bed and the storage unit, based on fire spread and the pattern of damage.
- The bed was most severely damaged on the side facing the storage unit.
- The wooden structure and combustible contents of the storage unit had been consumed.
- The desk showed greater damage on the side nearest the storage unit.
- The wooden floor was severely damaged in the ignition area.
A V-shaped pattern was visible near the area of origin. Another V-shaped pattern appeared on the opposite side of the room, where combustible material had burned. In this experiment, that second pattern was away from the area of origin.
Measurement procedure
A grid made of light.
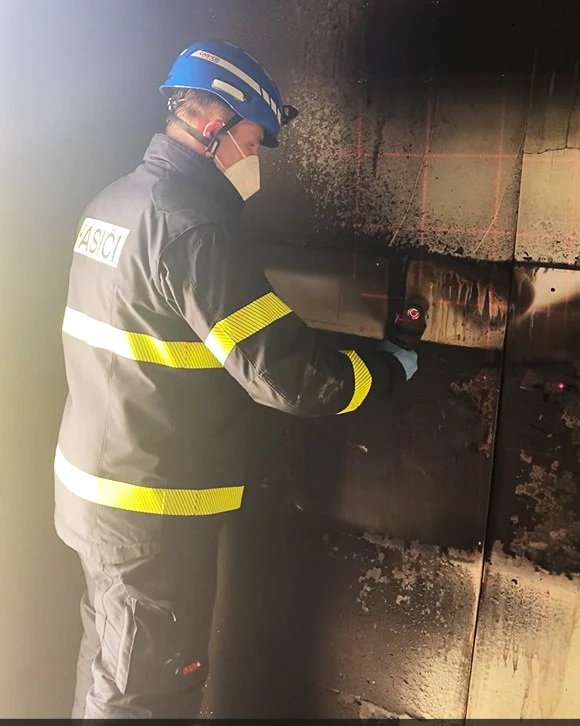
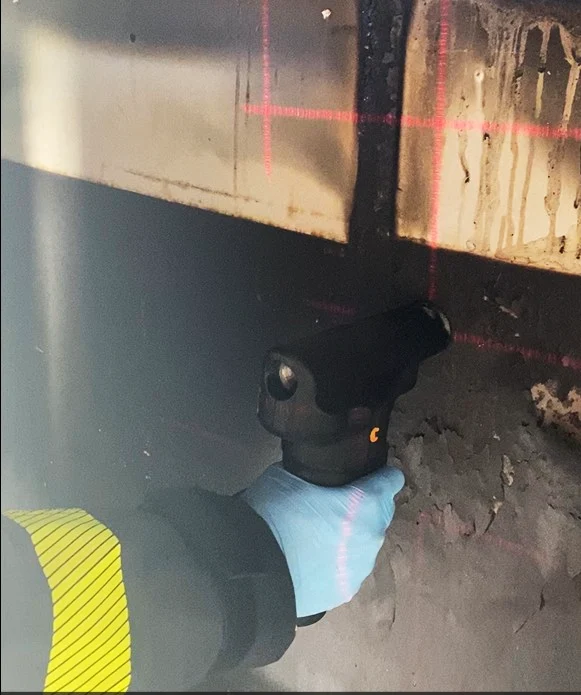
After the inspection and removal of the burned furniture, the measurement area was selected. Calcination depth was then measured with the handheld instrument at the intersections of horizontal and vertical laser lines.
The operator worked from the side to avoid blocking the projected grid. Several parts of the wall had been shielded by furniture and showed small calcination depths. These shielded areas helped relate the depth map to the original room layout.
Results & interpretation
From points to a pattern.
In this experiment, the largest calcination depths were recorded in the area between the bed and the storage unit—the area of origin established during the inspection. From this area, the distribution of calcination depth formed a V-shaped pattern that was also partly visible on the wall.
The same area was the only location with comparably high calcination depths close to floor level. Smaller readings in the shielded areas helped connect the measurements with the furniture positions. The results were interpreted together with the damage and fire-spread observations from the room.
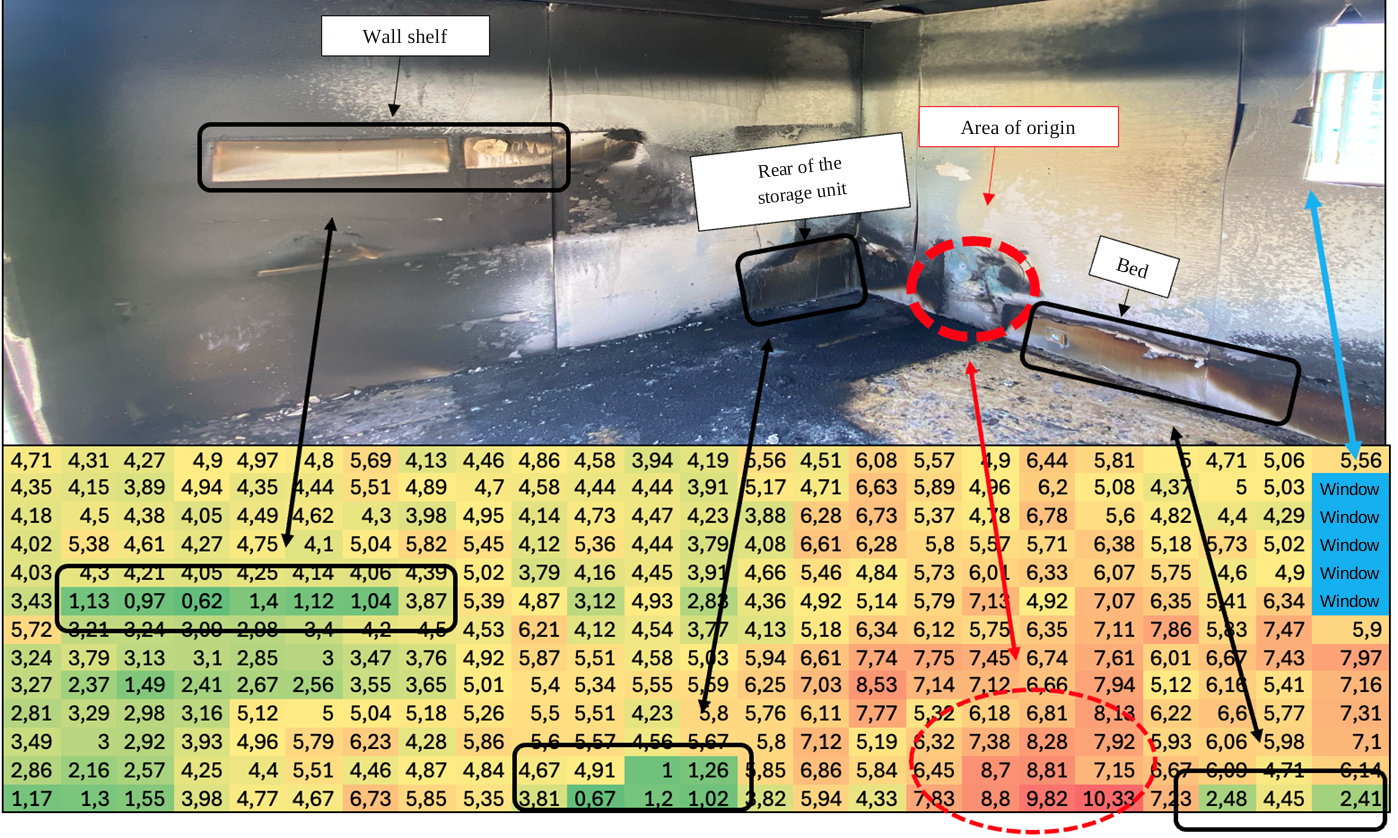
Calcination depth in millimetres. The figure retains the original decimal-comma notation. Green to red indicates lower to higher readings; blue cells mark the window.
Read the measurements as a table
| Row | A | B | C | D | E | F | G | H | I | J | K | L | M | N | O | P | Q | R | S | T | U | V | W | X |
|---|---|---|---|---|---|---|---|---|---|---|---|---|---|---|---|---|---|---|---|---|---|---|---|---|
| 1 | 4.71 | 4.31 | 4.27 | 4.90 | 4.97 | 4.80 | 5.69 | 4.13 | 4.46 | 4.86 | 4.58 | 3.94 | 4.19 | 5.56 | 4.51 | 6.08 | 5.57 | 4.90 | 6.44 | 5.81 | 5.00 | 4.71 | 5.06 | 5.56 |
| 2 | 4.35 | 4.15 | 3.89 | 4.94 | 4.35 | 4.44 | 5.51 | 4.89 | 4.70 | 4.58 | 4.44 | 4.44 | 3.91 | 5.17 | 4.71 | 6.63 | 5.89 | 4.96 | 6.20 | 5.08 | 4.37 | 5.00 | 5.03 | — |
| 3 | 4.18 | 4.50 | 4.38 | 4.05 | 4.49 | 4.62 | 4.30 | 3.98 | 4.95 | 4.14 | 4.73 | 4.47 | 4.23 | 3.88 | 6.28 | 6.73 | 5.37 | 4.78 | 6.78 | 5.60 | 4.82 | 4.40 | 4.29 | — |
| 4 | 4.02 | 5.38 | 4.61 | 4.27 | 4.75 | 4.10 | 5.04 | 5.82 | 5.45 | 4.12 | 5.36 | 4.44 | 3.79 | 4.08 | 6.61 | 6.28 | 5.80 | 5.57 | 5.71 | 6.38 | 5.18 | 5.73 | 5.02 | — |
| 5 | 4.03 | 4.30 | 4.21 | 4.05 | 4.25 | 4.14 | 4.06 | 4.39 | 5.02 | 3.79 | 4.16 | 4.45 | 3.91 | 4.66 | 5.46 | 4.84 | 5.73 | 6.01 | 6.33 | 6.07 | 5.75 | 4.60 | 4.90 | — |
| 6 | 3.43 | 1.13 | 0.97 | 0.62 | 1.40 | 1.12 | 1.04 | 3.87 | 5.39 | 4.87 | 3.12 | 4.93 | 2.83 | 4.36 | 4.92 | 5.14 | 5.79 | 7.13 | 4.92 | 7.07 | 6.35 | 5.41 | 6.34 | — |
| 7 | 5.72 | 3.21 | 3.24 | 3.09 | 2.98 | 3.40 | 4.20 | 4.50 | 4.53 | 6.21 | 4.12 | 4.54 | 3.77 | 4.13 | 5.18 | 6.34 | 6.12 | 5.75 | 6.35 | 7.11 | 7.86 | 5.83 | 7.47 | 5.90 |
| 8 | 3.24 | 3.79 | 3.13 | 3.10 | 2.85 | 3.00 | 3.47 | 3.76 | 4.92 | 5.87 | 5.51 | 4.58 | 5.03 | 5.94 | 6.61 | 7.74 | 7.75 | 7.45 | 6.74 | 7.61 | 6.01 | 6.67 | 7.43 | 7.97 |
| 9 | 3.27 | 2.37 | 1.49 | 2.41 | 2.67 | 2.56 | 3.55 | 3.65 | 5.01 | 5.40 | 5.34 | 5.55 | 5.59 | 6.25 | 7.03 | 8.53 | 7.14 | 7.12 | 6.66 | 7.94 | 5.12 | 6.16 | 5.41 | 7.16 |
| 10 | 2.81 | 3.29 | 2.98 | 3.16 | 5.12 | 5.00 | 5.04 | 5.18 | 5.26 | 5.50 | 5.51 | 4.23 | 5.80 | 5.76 | 6.11 | 7.77 | 5.32 | 6.18 | 6.81 | 8.13 | 6.22 | 6.60 | 5.77 | 7.31 |
| 11 | 3.49 | 3.00 | 2.92 | 3.93 | 4.96 | 5.79 | 6.23 | 4.28 | 5.86 | 5.60 | 5.57 | 4.56 | 5.67 | 5.80 | 7.12 | 5.19 | 6.32 | 7.38 | 8.28 | 7.92 | 5.93 | 6.06 | 5.98 | 7.10 |
| 12 | 2.86 | 2.16 | 2.57 | 4.25 | 4.40 | 5.51 | 4.46 | 4.87 | 4.84 | 4.67 | 4.91 | 1.00 | 1.26 | 5.85 | 6.86 | 5.84 | 6.45 | 8.70 | 8.81 | 7.15 | 6.67 | 6.09 | 4.71 | 6.14 |
| 13 | 1.17 | 1.30 | 1.55 | 3.98 | 4.77 | 4.67 | 6.73 | 5.85 | 5.35 | 3.81 | 0.67 | 1.20 | 1.02 | 3.82 | 5.94 | 4.33 | 7.83 | 8.80 | 9.82 | 10.33 | 7.23 | 2.48 | 4.45 | 2.41 |
307 readings and 5 window positions, preserved in their original row and column order from the “Pistol” worksheet. The accessible table displays two decimal places.
Position D6
Position T13
The measurement pattern was consistent with the area of origin identified through scene inspection.
Case study and photographs supplied by Jakub Baca. This page presents the experimental account and measurement results; it is not the full dissertation.